Whether you are a business owner, marketing manager or simply just interested in the world of ecommerce, you may be familiar with how a business can approach SEO.
To every person involved, the perception of SEO and its success can vary from a sophisticated technical grasp to a knowledge of the essentials.
At all levels, measurement and understanding of search data are crucial and different metrics will stand out; from rankings to the finer details of goals and page speed.
As you may know, you can’t rely solely on ranks as a method to track your progress. But there are other, simple ways to measure the impact of SEO on a business.
In a recent AMA on Reddit, Google’s own Gary Illyes recently urged SEO professionals to stick to the basics and this way of thinking can be applied to the measurement of organic search performance.
In this article, we will look to understand the best metrics for your business when it comes to understanding the impact of SEO, and how they can be viewed from a technical and commercial perspective. Before we start, it’s worth mentioning that this article has used Google’s own demo analytics account for screenshots. If you need further info to get to grips, check out this article, or access the demo version of Google Analytics.
Each of these are commercial SEO metrics — data that means something to everyone in a business.
Organic traffic
This is undoubtedly a simple, if not the most simple way of understanding the return of any SEO efforts. The day-to-day traffic from search engines is the key measure for many marketers and any increase can often be tied to an improved level of search visibility (excluding seasonal variation).
In a world where data drives decisions, these figures are pretty important and represent a key part of any internet user’s session, whether that is to get an answer, make a purchase or something else.
In Google Analytics, simply head follow this path: Acquisition -> All Traffic -> Channels to see the organic traffic received within your chosen time period
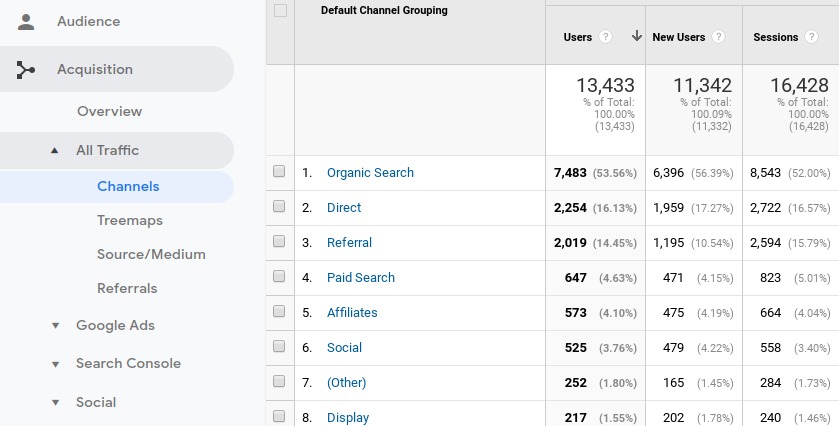
You might be asking, “how can I know more?”
Google might have restricted access to keyword data back in 2011, but you can still dig down into your traffic from organic search to look at landing pages and locations.
Organic traffic data – Filtered by landing page
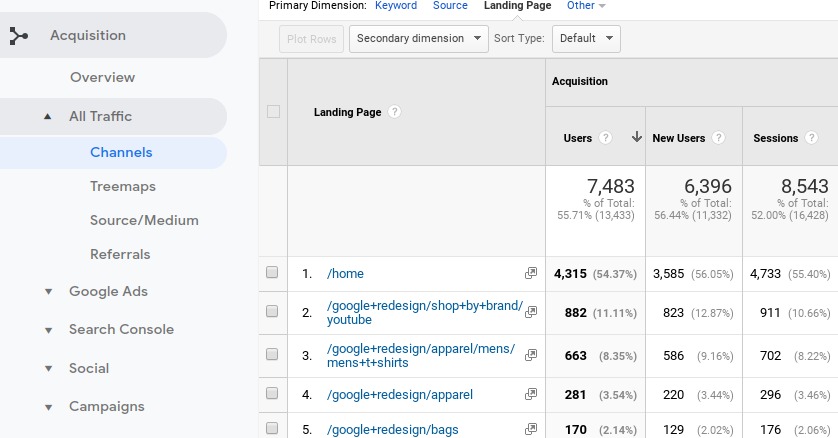
Not all traffic from search hits your homepage, some users head to your blog or to specific landing pages, depending on their needs. For some searches, however, like those for your company name, your homepage will be the most likely option.
To understand the split of traffic across your site, use the “Landing Page” primary dimension and explore the new data, split by specific page URL.
Organic traffic data – Filtered by location
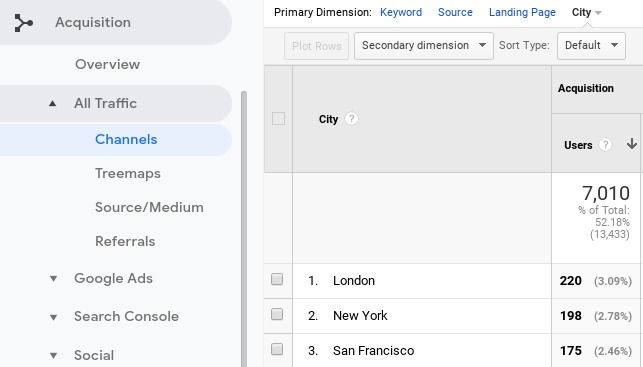
Within the same section, the organic search data can be split by location, such as city, to give even further detail on the makeup of your search traffic. Depending on how your business operates, the locations shown may be within the same country or across international locations. If you have spent time optimizing for audiences in specific areas, this view will be key to monitor overall performance.

Revenue, conversions, and goals
In most cases, your website is likely to be set up to draw conversions, whether that is product sales, document downloads, or leads.
Part of understanding the success of SEO, is the contribution to the goal of a business, whether that is monetary or lead-based.
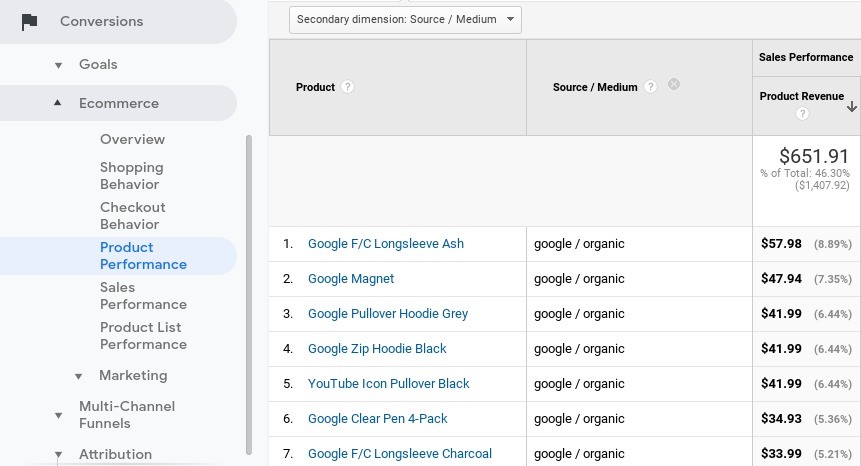
For revenue based data, head to the conversions section within Google analytics, then select the product performance. Within that section, filter the secondary dimension by source/medium to show just sales that originate from search engine traffic.
If your aim isn’t totally revenue based, perhaps a signup form or some downloadable content, then custom analytics goals are your way of fully understanding the actions of visitors that originate from search engines.
Within the conversions section, the source of your goal completions can be split by source, allowing you to focus on solely visits from organic search.

If a visitor finds your site from a search and then buys something or registers their details, it really suggests you are visible to the right audience.
However, if you are getting consistent organic search visits with no further actions taken, that suggests the key terms you rank for, aren’t totally relevant to your website.
SEO efforts should focus on reaching the relevant audiences, you might rank #1 for a search query like “cat food” but if you only sell dog products, your optimization hasn’t quite worked.
Search and local visibility
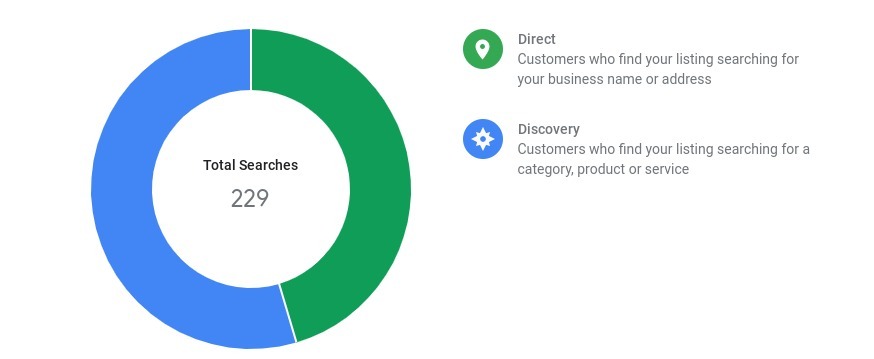
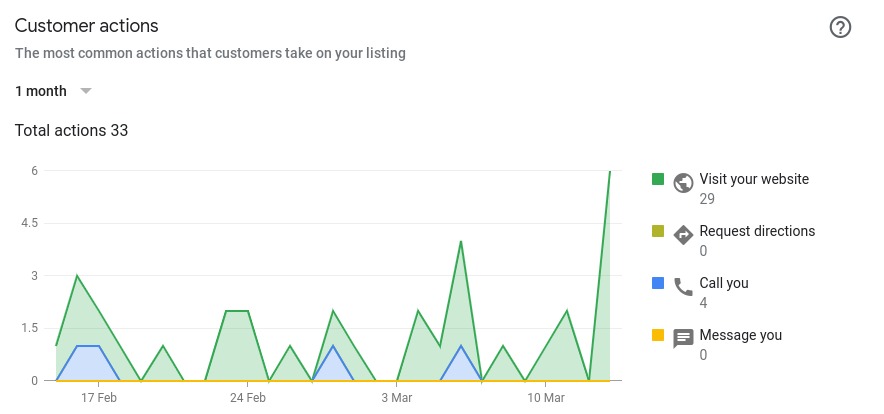
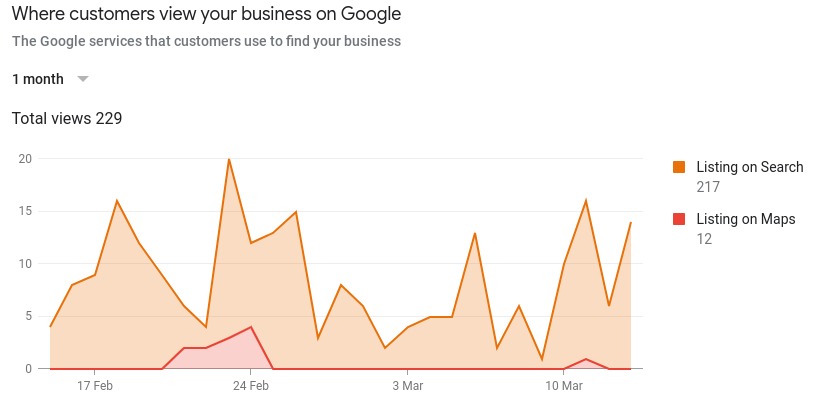
In the case that your business has web and/or physical store presences, you can use the tools within Google My Business to look further into and beyond the performance of the traditional blue links.
Specifically, you can understand the following:
- How customers search for your business
- How someone sees your business
- What specific actions they take
The better your optimization, the more of these actions you will see, check these out!
Average search rankings
Rankings for your key terms on search engines have traditionally been an easy way to quickly get a view of overall performance. However, a “quick Google” can be hard to draw conclusions from. Personalized search from your history and location essentially skews average rank to a point where its use has been diminished.
A variety of tools can be used to get a handle on average rankings for specific terms. The free way to do this is through Google Search Console with freemium tools like SEMRush and Ahrefs, which also offer an ability to understand average rank distribution.
With search rankings becoming harder to accurately track, the measure of averages is the best way to understand how search ranking relates to and impacts the wider business.

Technical metrics – Important but not everyone pays attention to these
When it comes to the more technical side of measuring SEO, you have to peel back the layers and look beyond clicks and traffic. They help complete the wider picture of SEO performance, plus they can help uncover additional opportunities for progress.
Search index – Through search consoles and other tools
Ensuring that an accurate index of your website exists is one thing that you need to do with SEO. Because if only a part of your site or the wrong pages are indexed, then your overall performance will suffer.
Although a small part of overall SEO work, its arguably one of the most crucial.
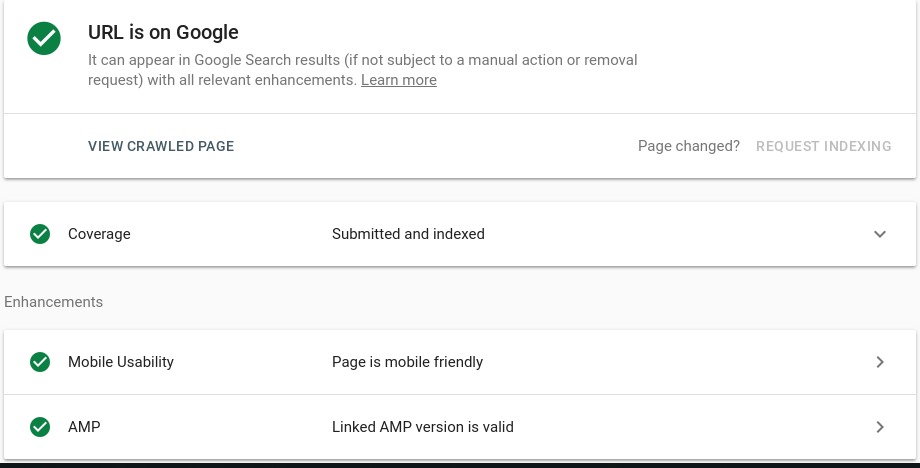
One quick way is to enter the command “site:” followed by the URL of your site’s homepage, to see the total number of pages that exist in a search engine’s index.
To inspect the status of a specific page on Google, the Google Search Console is your best option. The newest version of the search console provides a quick way to bring up results.
Search crawl errors
As well as looking at what has been indexed, any website owner needs to keep an eye out for what may be missing, or if there have been any crawl errors reported by Google. These often occur because a page has been blocked, or the format isn’t crawlable by Google.
Head to the “Coverage” tab within Google Search Console to understand the nature of any errors and what page the error relates to. If there’s a big zero, then you and your business naturally have nothing to worry about.

Click-through rate (CTR) and bounce rate
In addition to where and how your website ranks for searches, a metric to consider is how often your site listing is clicked in the SERPs. Essentially, this shows the percentage of impressions that result in a site visit.
This percentage indicates how relevant your listing is to the original query and how well your result ranks compared to your competitors.
If people like what they see and can easily find your website, then you’ll likely get a new site visit.
The Google Search Console is the best go-to resource again for the most accurate data. Just select the performance tab and toggle the CTR tab to browse data by query, landing page, country of origin, and device.
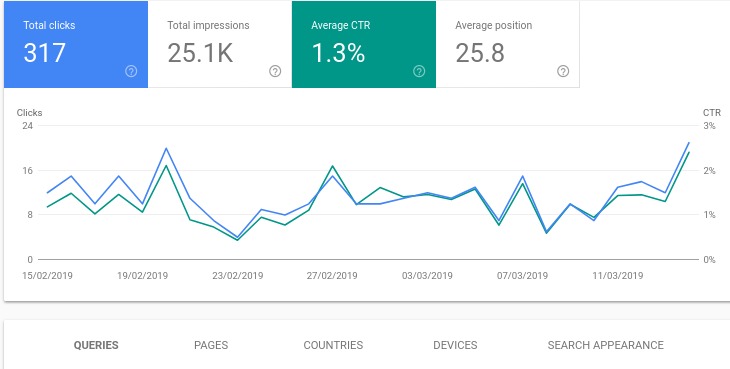
If someone does venture onto your site, you will want to ensure the page they see, is relevant to their search, after all, search algorithms love to reward relevance! If the page doesn’t contain the information required or isn’t user-friendly, then it is likely the user will leave to find a better resource, without taking any action, known as a bounce.
In some cases, one visit may be all that is needed, therefore a bounce isn’t an issue. Make sure to view this metric in the wider context of what your business offers.
Mobile friendliness
Widely reported in 2015, was the unveiling of mobile-friendliness as a ranking factor. This is crucial to the evolution of browser behavior, with mobile traffic, often greater in volume than desktop for some sites.
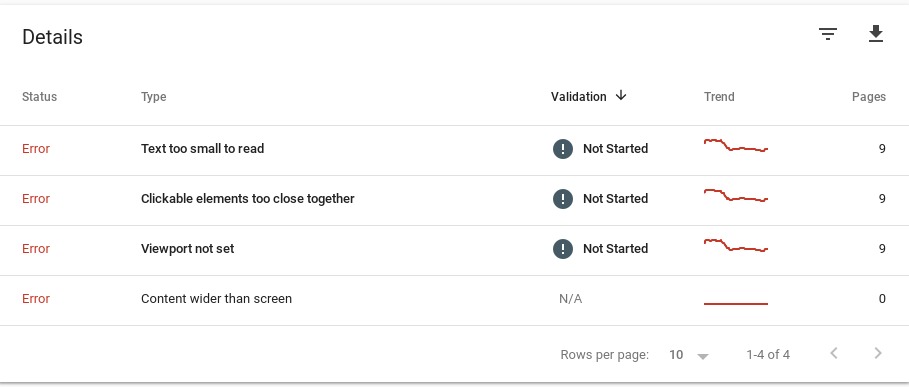
Another report in the ever useful Google Search Console gives a clear low-down of how mobile-friendly a site is, showing warnings for any issues. It’s worth saying, this measure isn’t an indication of how likely a conversion is, but more the quality of your site on a mobile device.
Follow your metrics and listen to the data
As mentioned at the start of this article, data drives decisions. In all areas of business, certain numbers will stand out. With SEO, a full understanding comes from multiple data points, with positives and negatives to be taken at every point of the journey.
Ultimately, it often comes down to traffic, ranks, and conversions, the numbers that definitely drive business are made up of the metrics that don’t often see the light of day but are just as important.
As a digital marketer, it is always a learning experience to know how data drives the evolution of a business and ultimately, how successes and opportunities are reported and understood.
Matthew Ramsay is Digital Marketing Manager at Digitaloft.
Further reading:
- How to take advantage of the latest updates to Google Search Console
- Complete guide to Google Search Console
- Progressive web apps (PWAs) for SEO: Benefits, stats, examples
- How to perfectly balance affiliate marketing and SEO
The post The SEO metrics that really matter for your business appeared first on Search Engine Watch.
from SEO – Search Engine Watch http://bit.ly/2PJiPqI
via IFTTT

No comments:
Post a Comment