Innovate not imitate!

Innovate not imitate!
Interested in the latest Growth hacks?

Welcome to our blog

Interested in the latest Growth hacks?

Welcome to our blog!

We want to help you start/manage and grow your business using innovative strategies and implementation. We have a passion for helping businesses and companies of various sizes see the same success that we have achieved.

Our skillsets are wide and varied, from business strategy, marketing, to online strategy. An increasing number of companies are turning to the internet and online media as a means to maximising their marketing reach and exposure. This is special area of focus for us and we do more than simple SEO strategies.

See our website for more: www.innovatetoaccelerate.com

Monday, 18 February 2019

Build a Search Intent Dashboard to Unlock Better Opportunities

Posted by scott.taft

We've been talking a lot about search intent this week, and if you've been following along, you’re likely already aware of how “search intent” is essential for a robust SEO strategy. If, however, you’ve ever laboured for hours classifying keywords by topic and search intent, only to end up with a ton of data you don’t really know what to do with, then this post is for you.

I’m going to share how to take all that sweet keyword data you’ve categorized, put it into a Power BI dashboard, and start slicing and dicing to uncover a ton insights — faster than you ever could before.

Building your keyword list

Every great search analysis starts with keyword research and this one is no different. I’m not going to go into excruciating detail about how to build your keyword list. However, I will mention a few of my favorite tools that I’m sure most of you are using already:

  • Search Query Report — What better place to look first than the search terms already driving clicks and (hopefully) conversions to your site.
  • Answer The Public — Great for pulling a ton of suggested terms, questions and phrases related to a single search term.
  • InfiniteSuggest — Like Answer The Public, but faster and allows you to build based on a continuous list of seed keywords.
  • MergeWords — Quickly expand your keywords by adding modifiers upon modifiers.
  • Grep Words — A suite of keyword tools for expanding, pulling search volume and more.

Please note that these tools are a great way to scale your keyword collecting but each will come with the need to comb through and clean your data to ensure all keywords are at least somewhat relevant to your business and audience.

Once I have an initial keyword list built, I’ll upload it to STAT and let it run for a couple days to get an initial data pull. This allows me to pull the ‘People Also Ask’ and ‘Related Searches’ reports in STAT to further build out my keyword list. All in all, I’m aiming to get to at least 5,000 keywords, but the more the merrier.

For the purposes of this blog post I have about 19,000 keywords I collected for a client in the window treatments space.

Categorizing your keywords by topic

Bucketing keywords into categories is an age-old challenge for most digital marketers but it’s a critical step in understanding the distribution of your data. One of the best ways to segment your keywords is by shared words. If you’re short on AI and machine learning capabilities, look no further than a trusty Ngram analyzer. I love to use this Ngram Tool from guidetodatamining.com — it ain’t much to look at, but it’s fast and trustworthy.

After dropping my 19,000 keywords into the tool and analyzing by unigram (or 1-word phrases), I manually select categories that fit with my client’s business and audience. I also make sure the unigram accounts for a decent amount of keywords (e.g. I wouldn’t pick a unigram that has a count of only 2 keywords).

Using this data, I then create a Category Mapping table and map a unigram, or “trigger word”, to a Category like the following:

You’ll notice that for “curtain” and “drapes” I mapped both to the Curtains category. For my client’s business, they treat these as the same product, and doing this allows me to account for variations in keywords but ultimately group them how I want for this analysis.

Using this method, I create a Trigger Word-Category mapping based on my entire dataset. It’s possible that not every keyword will fall into a category and that’s okay — it likely means that keyword is not relevant or significant enough to be accounted for.

Creating a keyword intent map

Similar to identifying common topics by which to group your keywords, I’m going to follow a similar process but with the goal of grouping keywords by intent modifier.

Search intent is the end goal of a person using a search engine. Digital marketers can leverage these terms and modifiers to infer what types of results or actions a consumer is aiming for.

For example, if a person searches for “white blinds near me”, it is safe to infer that this person is looking to buy white blinds as they are looking for a physical location that sells them. In this case I would classify “near me” as a “Transactional” modifier. If, however, the person searched “living room blinds ideas” I would infer their intent is to see images or read blog posts on the topic of living room blinds. I might classify this search term as being at the “Inspirational” stage, where a person is still deciding what products they might be interested and, therefore, isn’t quite ready to buy yet.

There is a lot of research on some generally accepted intent modifiers in search and I don’t intent to reinvent the wheel. This handy guide (originally published in STAT) provides a good review of intent modifiers you can start with.

I followed the same process as building out categories to build out my intent mapping and the result is a table of intent triggers and their corresponding Intent stage.

Intro to Power BI

There are tons of resources on how to get started with the free tool Power BI, one of which is from own founder Will Reynold’s video series on using Power BI for Digital Marketing. This is a great place to start if you’re new to the tool and its capabilities.

Note: it’s not about the tool necessarily (although Power BI is a super powerful one). It’s more about being able to look at all of this data in one place and pull insights from it at speeds which Excel just won’t give you. If you’re still skeptical of trying a new tool like Power BI at the end of this post, I urge you to get the free download from Microsoft and give it a try.

Setting up your data in Power BI

Power BI’s power comes from linking multiple datasets together based on common “keys." Think back to your Microsoft Access days and this should all start to sound familiar.

Step 1: Upload your data sources

First, open Power BI and you’ll see a button called “Get Data” in the top ribbon. Click that and then select the data format you want to upload. All of my data for this analysis is in CSV format so I will select the Text/CSV option for all of my data sources. You have to follow these steps for each data source. Click “Load” for each data source.

Step 2: Clean your data

In the Power BI ribbon menu, click the button called “Edit Queries." This will open the Query Editor where we will make all of our data transformations.

The main things you’ll want to do in the Query Editor are the following:

  • Make sure all data formats make sense (e.g. keywords are formatted as text, numbers are formatted as decimals or whole numbers).
  • Rename columns as needed.
  • Create a domain column in your Top 20 report based on the URL column.

Close and apply your changes by hitting the "Edit Queries" button, as seen above.

Step 3: Create relationships between data sources

On the left side of Power BI is a vertical bar with icons for different views. Click the third one to see your relationships view.

In this view, we are going to connect all data sources to our ‘Keywords Bridge’ table by clicking and dragging a line from the field ‘Keyword’ in each table and to ‘Keyword’ in the ‘Keywords Bridge’ table (note that for the PPC Data, I have connected ‘Search Term’ as this is the PPC equivalent of a keyword, as we’re using here).

The last thing we need to do for our relationships is double-click on each line to ensure the following options are selected for each so that our dashboard works properly:

  • The cardinality is Many to 1
  • The relationship is “active”
  • The cross filter direction is set to “both”

We are now ready to start building our Intent Dashboard and analyzing our data.

Building the search intent dashboard

In this section I’ll walk you through each visual in the Search Intent Dashboard (as seen below):

Top domains by count of keywords

Visual type: Stacked Bar Chart visual

Axis: I’ve nested URL under Domain so I can drill down to see this same breakdown by URL for a specific Domain

Value: Distinct count of keywords

Legend: Result Types

Filter: Top 10 filter on Domains by count of distinct keywords

Keyword breakdown by result type

Visual type: Donut chart

Legend: Result Types

Value: Count of distinct keywords, shown as Percent of grand total

Metric Cards

Sum of Distinct MSV

Because the Top 20 report shows each keyword 20 times, we need to create a calculated measure in Power BI to only sum MSV for the unique list of keywords. Use this formula for that calculated measure:

Sum Distinct MSV = SUMX(DISTINCT('Table'[Keywords]), FIRSTNONBLANK('Table'[MSV], 0))

Keywords

This is just a distinct count of keywords

Slicer: PPC Conversions

Visual type: Slicer

Drop your PPC Conversions field into a slicer and set the format to “Between” to get this nifty slider visual.

Tables

Visual type: Table or Matrix (a matrix allows for drilling down similar to a pivot table in Excel)

Values: Here I have Category or Intent Stage and then the distinct count of keywords.

Pulling insights from your search intent dashboard

This dashboard is now a Swiss Army knife of data that allows you to slice and dice to your heart’s content. Below are a couple examples of how I use this dashboard to pull out opportunities and insights for my clients.

Where are competitors winning?

With this data we can quickly see who the top competing domains are, but what’s more valuable is seeing who the competitors are for a particular intent stage and category.

I start by filtering to the “Informational” stage, since it represents the most keywords in our dataset. I also filter to the top category for this intent stage which is “Blinds”. Looking at my Keyword Count card, I can now see that I’m looking at a subset of 641 keywords.

Note: To filter multiple visuals in Power BI, you need to press and hold the “Ctrl” button each time you click a new visual to maintain all the filters you clicked previously.

The top competing subdomain here is videos.blinds.com with visibility in the top 20 for over 250 keywords, most of which are for video results. I hit ctrl+click on the Video results portion of videos.blinds.com to update the keywords table to only keywords where videos.blinds.com is ranking in the top 20 with a video result.

From all this I can now say that videos.blinds.com is ranking in the top 20 positions for about 30 percent of keywords that fall into the “Blinds” category and the “Informational” intent stage. I can also see that most of the keywords here start with “how to”, which tells me that most likely people searching for blinds in an informational stage are looking for how to instructions and that video may be a desired content format.

Where should I focus my time?

Whether you’re in-house or at an agency, time is always a hit commodity. You can use this dashboard to quickly identify opportunities that you should be prioritizing first — opportunities that can guarantee you’ll deliver bottom-line results.

To find these bottom-line results, we’re going to filter our data using the PPC conversions slicer so that our data only includes keywords that have converted at least once in our PPC campaigns.

Once I do that, I can see I’m working with a pretty limited set of keywords that have been bucketed into intent stages, but I can continue by drilling into the “Transactional” intent stage because I want to target queries that are linked to a possible purchase.

Note: Not every keyword will fall into an intent stage if it doesn’t meet the criteria we set. These keywords will still appear in the data, but this is the reason why your total keyword count might not always match the total keyword count in the intent stages or category tables.

From there I want to focus on those “Transactional” keywords that are triggering answer boxes to make sure I have good visibility, since they are converting for me on PPC. To do that, I filter to only show keywords triggering answer boxes. Based on these filters I can look at my keyword table and see most (if not all) of the keywords are “installation” keywords and I don’t see my client’s domain in the top list of competitors. This is now an area of focus for me to start driving organic conversions.

Wrap up

I’ve only just scratched the surface — there’s tons that can can be done with this data inside a tool like Power BI. Having a solid data set of keywords and visuals that I can revisit repeatedly for a client and continuously pull out opportunities to help fuel our strategy is, for me, invaluable. I can work efficiently without having to go back to keyword tools whenever I need an idea. Hopefully you find this makes building an intent-based strategy more efficient and sound for your business or clients.


Sign up for The Moz Top 10, a semimonthly mailer updating you on the top ten hottest pieces of SEO news, tips, and rad links uncovered by the Moz team. Think of it as your exclusive digest of stuff you don't have time to hunt down but want to read!


from The Moz Blog http://bit.ly/2GtOef3
via IFTTT

Detecting Link Manipulation and Spam with Domain Authority

Posted by rjonesx.

Over 7 years ago, while still an employee at Virante, Inc. (now Hive Digital), I wrote a post on Moz outlining some simple methods for detecting backlink manipulation by comparing one's backlink profile to an ideal model based on Wikipedia. At the time, I was limited in the research I could perform because I was a consumer of the API, lacking access to deeper metrics, measurements, and methodologies to identify anomalies in backlink profiles. We used these techniques in spotting backlink manipulation with tools like Remove'em and Penguin Risk, but they were always handicapped by the limitations of consumer facing APIs. Moreover, they didn't scale. It is one thing to collect all the backlinks for a site, even a large site, and judge every individual link for source type, quality, anchor text, etc. Reports like these can be accessed from dozens of vendors if you are willing to wait a few hours for the report to complete. But how do you do this for 30 trillion links every single day?

Since the launch of Link Explorer and my residency here at Moz, I have had the luxury of far less filtered data, giving me a far deeper, clearer picture of the tools available to backlink index maintainers to identify and counter manipulation. While I in no way intend to say that all manipulation can be detected, I want to outline just some of the myriad surprising methodologies to detect spam.

The general methodology

You don't need to be a data scientist or a math nerd to understand this simple practice for identifying link spam. While there certainly is a great deal of math used in the execution of measuring, testing, and building practical models, the general gist is plainly understandable.

The first step is to get a good random sample of links from the web, which you can read about here. But let's assume you have already finished that step. Then, for any property of those random links (DA, anchor text, etc.), you figure out what is normal or expected. Finally, you look for outliers and see if those correspond with something important - like sites that are manipulating the link graph, or sites that are exceptionally good. Let's start with an easy example, link decay.

Link decay and link spam

Link decay is the natural occurrence of links either dropping off the web or changing URLs. For example, if you get links after you send out a press release, you would expect some of those links to eventually disappear as the pages are archived or removed for being old. And, if you were to get a link from a blog post, you might expect to have a homepage link on the blog until that post is pushed to the second or third page by new posts.

But what if you bought your links? What if you own a large number of domains and all the sites link to each other? What if you use a PBN? These links tend not to decay. Exercising control over your inbound links often means that you keep them from ever decaying. Thus, we can create a simple hypothesis:

Hypothesis: The link decay rate of sites manipulating the link graph will differ from sites with natural link profiles.

The methodology for testing this hypothesis is just as we discussed before. We first figure out what is natural. What does a random site's link decay rate look like? Well, we simply get a bunch of sites and record how fast links are deleted (we visit a page and see a link is gone) vs. their total number of links. We then can look for anomalies.

In this case of anomaly hunting, I'm going to make it really easy. No statistics, no math, just a quick look at what pops up when we first sort by Lowest Decay Rate and then sort by Highest Domain Authority to see who is at the tail-end of the spectrum.

spreadsheet of sites with high deleted link ratios

Success! Every example we see of a good DA score but 0 link decay appears to be powered by a link network of some sort. This is the Aha! moment of data science that is so fun. What is particularly interesting is we find spam on both ends of the distribution — that is to say, sites that have 0 decay or near 100% decay rates both tend to be spammy. The first type tends to be part of a link network, the second part tends to spam their backlinks to sites others are spamming, so their links quickly shuffle off to other pages.

Of course, now we do the hard work of building a model that actually takes this into account and accurately reduces Domain Authority relative to the severity of the link spam. But you might be asking...

These sites don't rank in Google — why do they have decent DAs in the first place?

Well, this is a common problem with training sets. DA is trained on sites that rank in Google so that we can figure out who will rank above who. However, historically, we haven't (and no one to my knowledge in our industry has) taken into account random URLs that don't rank at all. This is something we're solving for in the new DA model set to launch in early March, so stay tuned, as this represents a major improvement on the way we calculate DA!

Spam Score distribution and link spam

One of the most exciting new additions to the upcoming Domain Authority 2.0 is the use of our Spam Score. Moz's Spam Score is a link-blind (we don't use links at all) metric that predicts the likelihood a domain will be indexed in Google. The higher the score, the worse the site.

Now, we could just ignore any links from sites with Spam Scores over 70 and call it a day, but it turns out there are fascinating patterns left behind by common link manipulation schemes waiting to be discovered by using this simple methodology of using a random sample of URLs to find out what a normal backlink profile looks like, and then see if there are anomalies in the way Spam Score is distributed among the backlinks to a site. Let me show you just one.

It turns out that acting natural is really hard to do. Even the best attempts often fall short, as did this particularly pernicious link spam network. This network had haunted me for 2 years because it included a directory of the top million sites, so if you were one of those sites, you could see anywhere from 200 to 600 followed links show up in your backlink profile. I called it "The Globe" network. It was easy to look at the network and see what they were doing, but could we spot it automatically so that we could devalue other networks like it in the future? When we looked at the link profile of sites included in the network, the Spam Score distribution lit up like a Christmas tree.

spreadsheet with distribution of spam scores

Most sites get the majority of their backlinks from low Spam Score domains and get fewer and fewer as the Spam Score of the domains go up. But this link network couldn't hide because we were able to detect the sites in their network as having quality issues using Spam Score. If we relied only on ignoring the bad Spam Score links, we would have never discovered this issue. Instead, we found a great classifier for finding sites that are likely to be penalized by Google for bad link building practices.

DA distribution and link spam

We can find similar patterns among sites with the distribution of inbound Domain Authority. It's common for businesses seeking to increase their rankings to set minimum quality standards on their outreach campaigns, often DA30 and above. An unfortunate outcome of this is that what remains are glaring examples of sites with manipulated link profiles.

Let me take a moment and be clear here. A manipulated link profile is not necessarily against Google's guidelines. If you do targeted PR outreach, it is reasonable to expect that such a distribution might occur without any attempt to manipulate the graph. However, the real question is whether Google wants sites that perform such outreach to perform better. If not, this glaring example of link manipulation is pretty easy for Google to dampen, if not ignore altogether.

spreadsheet with distribution of domain authorityA normal link graph for a site that is not targeting high link equity domains will have the majority of their links coming from DA0–10 sites, slightly fewer for DA10–20, and so on and so forth until there are almost no links from DA90+. This makes sense, as the web has far more low DA sites than high. But all the sites above have abnormal link distributions, which make it easy to detect and correct — at scale — link value.

Now, I want to be clear: these are not necessarily examples of violating Google's guidelines. However, they are manipulations of the link graph. It's up to you to determine whether you believe Google takes the time to differentiate between how the outreach was conducted that resulted in the abnormal link distribution.

What doesn't work

For every type of link manipulation detection method we discover, we scrap dozens more. Some of these are actually quite surprising. Let me write about just one of the many.

The first surprising example was the ratio of nofollow to follow links. It seems pretty straightforward that comment, forum, and other types of spammers would end up accumulating lots of nofollowed links, thereby leaving a pattern that is easy to discern. Well, it turns out this is not true at all.

The ratio of nofollow to follow links turns out to be a poor indicator, as popular sites like facebook.com often have a higher ratio than even pure comment spammers. This is likely due to the use of widgets and beacons and the legitimate usage of popular sites like facebook.com in comments across the web. Of course, this isn't always the case. There are some sites with 100% nofollow links and a high number of root linking domains. These anomalies, like "Comment Spammer 1," can be detected quite easily, but as a general measurement the ratio does not serve as a good classifier for spam or ham.

So what's next?

Moz is continually traversing the the link graph looking for ways to improve Domain Authority using everything from basic linear algebra to complex neural networks. The goal in mind is simple: We want to make the best Domain Authority metric ever. We want a metric which users can trust in the long run to root out spam just like Google (and help you determine when you or your competitors are pushing the limits) while at the same time maintaining or improving correlations with rankings. Of course, we have no expectation of rooting out all spam — no one can do that. But we can do a better job. Led by the incomparable Neil Martinsen-Burrell, our metric will stand alone in the industry as the canonical method for measuring the likelihood a site will rank in Google.


We're launching Domain Authority 2.0 on March 5th! Check out our helpful resources here, or sign up for our webinar this Thursday, February 21st for more info on how to communicate changes like this to clients and stakeholders:

Save my spot!


Sign up for The Moz Top 10, a semimonthly mailer updating you on the top ten hottest pieces of SEO news, tips, and rad links uncovered by the Moz team. Think of it as your exclusive digest of stuff you don't have time to hunt down but want to read!


from The Moz Blog http://bit.ly/2ImgDFH
via IFTTT

Friday, 15 February 2019

4 Ways to Improve Your Data Hygiene - Whiteboard Friday

Posted by DiTomaso

We base so much of our livelihood on good data, but managing that data properly is a task in and of itself. In this week's Whiteboard Friday, Dana DiTomaso shares why you need to keep your data clean and some of the top things to watch out for.

Click on the whiteboard image above to open a high resolution version in a new tab!

Video Transcription

Hi. My name is Dana DiTomaso. I am President and partner at Kick Point. We're a digital marketing agency, based in the frozen north of Edmonton, Alberta. So today I'm going to be talking to you about data hygiene.

What I mean by that is the stuff that we see every single time we start working with a new client this stuff is always messed up. Sometimes it's one of these four things. Sometimes it's all four, or sometimes there are extra things. So I'm going to cover this stuff today in the hopes that perhaps the next time we get a profile from someone it is not quite as bad, or if you look at these things and see how bad it is, definitely start sitting down and cleaning this stuff up.

1. Filters

So what we're going to start with first are filters. By filters, I'm talking about analytics here, specifically Google Analytics. When go you into the admin of Google Analytics, there's a section called Filters. There's a section on the left, which is all the filters for everything in that account, and then there's a section for each view for filters. Filters help you exclude or include specific traffic based on a set of parameters.

Filter out office, home office, and agency traffic

So usually what we'll find is one Analytics property for your website, and it has one view, which is all website data which is the default that Analytics gives you, but then there are no filters, which means that you're not excluding things like office traffic, your internal people visiting the website, or home office. If you have a bunch of people who work from home, get their IP addresses, exclude them from this because you don't necessarily want your internal traffic mucking up things like conversions, especially if you're doing stuff like checking your own forms.

You haven't had a lead in a while and maybe you fill out the form to make sure it's working. You don't want that coming in as a conversion and then screwing up your data, especially if you're a low-volume website. If you have a million hits a day, then maybe this isn't a problem for you. But if you're like the rest of us and don't necessarily have that much traffic, something like this can be a big problem in terms of the volume of traffic you see. Then agency traffic as well.

So agencies, please make sure that you're filtering out your own traffic. Again things like your web developer, some contractor you worked with briefly, really make sure you're filtering out all that stuff because you don't want that polluting your main profile.

Create a test and staging view

The other thing that I recommend is creating what we call a test and staging view. Usually in our Analytics profiles, we'll have three different views. One we call master, and that's the view that has all these filters applied to it.

So you're only seeing the traffic that isn't you. It's the customers, people visiting your website, the real people, not your office people. Then the second view we call test and staging. So this is just your staging server, which is really nice. For example, if you have a different URL for your staging server, which you should, then you can just include that traffic. Then if you're making enhancements to the site or you upgraded your WordPress instance and you want to make sure that your goals are still firing correctly, you can do all that and see that it's working in the test and staging view without polluting your main view.

Test on a second property

That's really helpful. Then the third thing is make sure to test on a second property. This is easy to do with Google Tag Manager. What we'll have set up in most of our Google Tag Manager accounts is we'll have our usual analytics and most of the stuff goes to there. But then if we're testing something new, like say the content consumption metric we started putting out this summer, then we want to make sure we set up a second Analytics view and we put the test, the new stuff that we're trying over to the second Analytics property, not view.

So you have two different Analytics properties. One is your main property. This is where all the regular stuff goes. Then you have a second property, which is where you test things out, and this is really helpful to make sure that you're not going to screw something up accidentally when you're trying out some crazy new thing like content consumption, which can totally happen and has definitely happened as we were testing the product. You don't want to pollute your main data with something different that you're trying out.

So send something to a second property. You do this for websites. You always have a staging and a live. So why wouldn't you do this for your analytics, where you have a staging and a live? So definitely consider setting up a second property.

2. Time zones

The next thing that we have a lot of problems with are time zones. Here's what happens.

Let's say your website, basic install of WordPress and you didn't change the time zone in WordPress, so it's set to UTM. That's the default in WordPress unless you change it. So now you've got your data for your website saying it's UTM. Then let's say your marketing team is on the East Coast, so they've got all of their tools set to Eastern time. Then your sales team is on the West Coast, so all of their tools are set to Pacific time.

So you can end up with a situation where let's say, for example, you've got a website where you're using a form plugin for WordPress. Then when someone submits a form, it's recorded on your website, but then that data also gets pushed over to your sales CRM. So now your website is saying that this number of leads came in on this day, because it's in UTM mode. Well, the day ended, or it hasn't started yet, and now you've got Eastern, which is when your analytics tools are recording the number of leads.

But then the third wrinkle is then you have Salesforce or HubSpot or whatever your CRM is now recording Pacific time. So that means that you've got this huge gap of who knows when this stuff happened, and your data will never line up. This is incredibly frustrating, especially if you're trying to diagnose why, for example, I'm submitting a form, but I'm not seeing the lead, or if you've got other data hygiene issues, you can't match up the data and that's because you have different time zones.

So definitely check the time zones of every product you use --website, CRM, analytics, ads, all of it. If it has a time zone, pick one, stick with it. That's your canonical time zone. It will save you so many headaches down the road, trust me.

3. Attribution

The next thing is attribution. Attribution is a whole other lecture in and of itself, beyond what I'm talking about here today.

Different tools have different ways of showing attribution

But what I find frustrating about attribution is that every tool has its own little special way of doing it. Analytics is like the last non-direct click. That's great. Ads says, well, maybe we'll attribute it, maybe we won't. If you went to the site a week ago, maybe we'll call it a view-through conversion. Who knows what they're going to call it? Then Facebook has a completely different attribution window.

You can use a tool, such as Supermetrics, to change the attribution window. But if you don't understand what the default attribution window is in the first place, you're just going to make things harder for yourself. Then there's HubSpot, which says the very first touch is what matters, and so, of course, HubSpot will never agree with Analytics and so on. Every tool has its own little special sauce and how they do attribution. So pick a source of truth.

Pick your source of truth

This is the best thing to do is just say, "You know what? I trust this tool the most." Then that is your source of truth. Do not try to get this source of truth to match up with that source of truth. You will go insane. You do have to make sure that you are at least knowing that things like your time zones are clear so that's all set.

Be honest about limitations

But then after that, really it's just making sure that you're being honest about your limitations.

Know where things are necessarily going to fall down, and that's okay, but at least you've got this source of truth that you at least can trust. That's the most important thing with attribution. Make sure to spend the time and read how each tool handles attribution so when someone comes to you and says, "Well, I see that we got 300 visits from this ad campaign, but in Facebook it says we got 6,000.

Why is that? You have an answer. That might be a little bit of an extreme example, but I mean I've seen weirder things with Facebook attribution versus Analytics attribution. I've even talked about stuff like Mixpanel and Kissmetrics. Every tool has its own little special way of recording attributions. It's never the same as anyone else's. We don't have a standard in the industry of how this stuff works, so make sure you understand these pieces.

4. Interactions

Then the last thing are what I call interactions. The biggest thing that I find that people do wrong here is in Google Tag Manager it gives you a lot of rope, which you can hang yourself with if you're not careful.

GTM interactive hits

One of the biggest things is what we call an interactive hit versus a non-interactive hit. So let's say in Google Tag Manager you have a scroll depth.

You want to see how far down the page people scroll. At 25%, 50%, 75%, and 100%, it will send off an alert and say this is how far down they scrolled on the page. Well, the thing is that you can also make that interactive. So if somebody scrolls down the page 25%, you can say, well, that's an interactive hit, which means that person is no longer bounced, because it's counting an interaction, which for your setup might be great.

Gaming bounce rate

But what I've seen are unscrupulous agencies who come in and say if the person scrolls 2% of the way down the page, now that's an interactive hit. Suddenly the client's bounce rate goes down from say 80% to 3%, and they think, "Wow, this agency is amazing." They're not amazing. They're lying. This is where Google Tag Manager can really manipulate your bounce rate. So be careful when you're using interactive hits.

Absolutely, maybe it's totally fair that if someone is reading your content, they might just read that one page and then hit the back button and go back out. It's totally fair to use something like scroll depth or a certain piece of the content entering the user's view port, that that would be interactive. But that doesn't mean that everything should be interactive. So just dial it back on the interactions that you're using, or at least make smart decisions about the interactions that you choose to use. So you can game your bounce rate for that.

Goal setup

Then goal setup as well, that's a big problem. A lot of people by default maybe they have destination goals set up in Analytics because they don't know how to set up event-based goals. But what we find happens is by destination goal, I mean you filled out the form, you got to a thank you page, and you're recording views of that thank you page as goals, which yes, that's one way to do it.

But the problem is that a lot of people, who aren't super great at interneting, will bookmark that page or they'll keep coming back to it again and again because maybe you put some really useful information on your thank you page, which is what you should do, except that means that people keep visiting it again and again without actually filling out the form. So now your conversion rate is all messed up because you're basing it on destination, not on the actual action of the form being submitted.

So be careful on how you set up goals, because that can also really game the way you're looking at your data.

Ad blockers

Ad blockers could be anywhere from 2% to 10% of your audience depending upon how technically sophisticated your visitors are. So you'll end up in situations where you have a form fill, you have no corresponding visit to match with that form fill.

It just goes into an attribution black hole. But they did fill out the form, so at least you got their data, but you have no idea where they came from. Again, that's going to be okay. So definitely think about the percentage of your visitors, based on you and your audience, who probably have an ad blocker installed and make sure you're comfortable with that level of error in your data. That's just the internet, and ad blockers are getting more and more popular.

Stuff like Apple is changing the way that they do tracking. So definitely make sure that you understand these pieces and you're really thinking about that when you're looking at your data. Again, these numbers may never 100% match up. That's okay. You can't measure everything. Sorry.

Bonus: Audit!

Then the last thing I really want you to think about — this is the bonus tip — audit regularly.

So at least once a year, go through all the different stuff that I've covered in this video and make sure that nothing has changed or updated, you don't have some secret, exciting new tracking code that somebody added in and then forgot because you were trying out a trial of this product and you tossed it on, and it's been running for a year even though the trial expired nine months ago. So definitely make sure that you're running the stuff that you should be running and doing an audit at least on an yearly basis.

If you're busy and you have a lot of different visitors to your website, it's a pretty high-volume property, maybe monthly or quarterly would be a better interval, but at least once a year go through and make sure that everything that's there is supposed to be there, because that will save you headaches when you look at trying to compare year-over-year and realize that something horrible has been going on for the last nine months and all of your data is trash. We really don't want to have that happen.

So I hope these tips are helpful. Get to know your data a little bit better. It will like you for it. Thanks.

Video transcription by Speechpad.com


Sign up for The Moz Top 10, a semimonthly mailer updating you on the top ten hottest pieces of SEO news, tips, and rad links uncovered by the Moz team. Think of it as your exclusive digest of stuff you don't have time to hunt down but want to read!


from The Moz Blog http://bit.ly/2IggJi2
via IFTTT

Wednesday, 13 February 2019

A guide to setting up your very own search intent projects

Posted by TheMozTeam

This post was originally published on the STAT blog.


Whether you’re tracking thousands or millions of keywords, if you expect to extract deep insights and trends just by looking at your keywords from a high-level, you’re not getting the full story.

Smart segmentation is key to making sense of your data. And you’re probably already applying this outside of STAT. So now, we’re going to show you how to do it in STAT to uncover boatloads of insights that will help you make super data-driven decisions.

To show you what we mean, let’s take a look at a few ways we can set up a search intent project to uncover the kinds of insights we shared in our whitepaper, Using search intent to connect with consumers.

Before we jump in, there are a few things you should have down pat:

1. Picking a search intent that works for you

Search intent is the motivating force behind search and it can be:

  • Informational: The searcher has identified a need and is looking for information on the best solution, ie. [blender], [food processor]
  • Commercial: The searcher has zeroed in on a solution and wants to compare options, ie. [blender reviews], [best blenders]
  • Transactional: The searcher has narrowed their hunt down to a few best options, and is on the precipice of purchase, ie. [affordable blenders], [blender cost]
    • Local (sub-category of transactional): The searcher plans to do or buy something locally, ie. [blenders in dallas]
    • Navigational (sub-category of transactional): The searcher wants to locate a specific website, ie. [Blendtec]

We left navigational intent out of our study because it’s brand specific and didn’t want to bias our data.

Our keyword set was a big list of retail products — from kitty pooper-scoopers to pricey speakers. We needed a straightforward way to imply search intent, so we added keyword modifiers to characterize each type of intent.

As always, different strokes for different folks: The modifiers you choose and the intent categories you look at may differ, but it’s important to map that all out before you get started.

2. Identifying the SERP features you really want

For our whitepaper research, we pretty much tracked every feature under the sun, but you certainly don’t have to.

You might already know which features you want to target, the ones you want to keep an eye on, or questions you want to answer. For example, are shopping boxes taking up enough space to warrant a PPC strategy?

In this blog post, we’re going to really focus-in on our most beloved SERP feature: featured snippets (called “answers” in STAT). And we’ll be using a sample project where we’re tracking 25,692 keywords against Amazon.com.

3. Using STAT’s segmentation tools

Setting up projects in STAT means making use of the segmentation tools. Here’s a quick rundown of what we used:

  • Standard tag: Best used to group your keywords into static themes — search intent, brand, product type, or modifier.
  • Dynamic tag: Like a smart playlist, automatically returns keywords that match certain criteria, like a given search volume, rank, or SERP feature appearance.
  • Data view: House any number of tags and show how those tags perform as a group.

Learn more about tags and data views in the STAT Knowledge Base.

Now, on to the main event…

1. Use top-level search intent to find SERP feature opportunities

To kick things off, we’ll identify the SERP features that appear at each level of search intent by creating tags.

Our first step is to filter our keywords and create standard tags for our search intent keywords (read more abou tfiltering keywords). Second, we create dynamic tags to track the appearance of specific SERP features within each search intent group. And our final step, to keep everything organized, is to place our tags in tidy little data views, according to search intent.

Here’s a peek at what that looks like in STAT:

What can we uncover?

Our standard tags (the blue tags) show how many keywords are in each search intent bucket: 2,940 commercial keywords. And our dynamic tags (the sunny yellow stars) show how many of those keywords return a SERP feature: 547 commercial keywords with a snippet.

This means we can quickly spot how much opportunity exists for each SERP feature by simply glancing at the tags. Boom!

By quickly crunching some numbers, we can see that snippets appear on 5 percent of our informational SERPs (27 out of 521), 19 percent of our commercial SERPs (547 out of 2,940), and 12 percent of our transactional SERPs (253 out of 2,058).

From this, we might conclude that optimizing our commercial intent keywords for featured snippets is the way to go since they appear to present the biggest opportunity. To confirm, let’s click on the commercial intent featured snippet tag to view the tag dashboard…

Voilà! There are loads of opportunities to gain a featured snippet.

Though, we should note that most of our keywords rank below where Google typically pulls the answer from. So, what we can see right away is that we need to make some serious ranking gains in order to stand a chance at grabbing those snippets.


2. Find SERP feature opportunities with intent modifiers

Now, let’s take a look at which SERP features appear most often for our different keyword modifiers.

To do this, we group our keywords by modifier and create a standard tag for each group. Then, we set up dynamic tags for our desired SERP features. Again, to keep track of all the things, we contained the tags in handy data views, grouped by search intent.

What can we uncover?

Because we saw that featured snippets appear most often for our commercial intent keywords, it’s time to drill on down and figure out precisely which modifiers within our commercial bucket are driving this trend.

Glancing quickly at the numbers in the tag titles in the image above, we can see that “best,” “reviews,” and “top” are responsible for the majority of the keywords that return a featured snippet:

  • 212 out of 294 of our “best” keywords (72%)
  • 109 out of 294 of our “reviews” keywords (37%)
  • 170 out of 294 of our “top” keywords (59%)

This shows us where our efforts are best spent optimizing.

By clicking on the “best — featured snippets” tag, we’re magically transported into the dashboard. Here, we see that our average ranking could use some TLC.


There is a lot of opportunity to snag a snippet here, but we (actually, Amazon, who we’re tracking these keywords against) don’t seem to be capitalizing on that potential as much as we could. Let’s drill down further to see which snippets we already own.

We know we’ve got content that has won snippets, so we can use that as a guideline for the other keywords that we want to target.


3. See which pages are ranking best by search intent

In our blog post How Google dishes out content by search intent, we looked at what type of pages — category pages, product pages, reviews — appear most frequently at each stage of a searcher’s intent.

What we found was that Google loves category pages, which are the engine’s top choice for retail keywords across all levels of search intent. Product pages weren’t far behind.

By creating dynamic tags for URL markers, or portions of your URL that identify product pages versus category pages, and segmenting those by intent, you too can get all this glorious data. That’s exactly what we did for our retail keywords

What can we uncover?

Looking at the tags in the transactional page types data view, we can see that product pages are appearing far more frequently (526) than category pages (151).

When we glanced at the dashboard, we found that slightly more than half of the product pages were ranking on the first page (sah-weet!). That said, more than thirty percent appeared on page three and beyond. So despite the initial visual of “doing well”, there’s a lot of opportunity that Amazon could be capitalizing on.

We can also see this in the Daily Snapshot. In the image above, we compare category pages (left) to product pages (right), and we see that while there are less category pages ranking, the rank is significantly better. Amazon could take some of the lessons they’ve applied to their category pages to help their product pages out.

Wrapping it up

So what did we learn today?

  1. Smart segmentation starts with a well-crafted list of keywords, grouped into tags, and housed in data views.
  2. The more you segment, the more insights you’re gonna uncover.
  3. Rely on the dashboards in STAT to flag opportunities and tell you what’s good, yo!

Want to see it all in action? Get a tailored walkthrough of STAT, here.

Or get your mitts on even more intent-based insights in our full whitepaper: Using search intent to connect with consumers.

Read on, readers!

More in our search intent series:


Sign up for The Moz Top 10, a semimonthly mailer updating you on the top ten hottest pieces of SEO news, tips, and rad links uncovered by the Moz team. Think of it as your exclusive digest of stuff you don't have time to hunt down but want to read!


from The Moz Blog http://bit.ly/2X45I6y
via IFTTT

Mobile search and video in 2019: How visible are you?

Here at Search Engine Watch we know that video content is a great way to achieve and maintain visibility online, as well as being a successful means for providing engaging content for followers and prospective customers.

A quick look at our Twitter feed is testament to that.

Last month I argued that YouTube channels could – and should – be optimized in much the same way as our videos and websites.

And Ann Smarty’s 5 YouTube optimization tips to improve your video rankings is worth a look if you want to ensure your videos are really sticking out from the crowd.

But in 2019 are there any other considerations for ensuring that our videos are visible?

We know that Google frequently tweaks its algorithm and we should assume that YouTube does too. We also know the habits of searchers and viewers change as time passes.

Today I want to turn our attention to video search visibility in the mobile context. After all, most of our search activity is mobile and most of our video viewing activity is as well. How should this affect the way we approach SEO for our video content?

How much search activity is mobile?

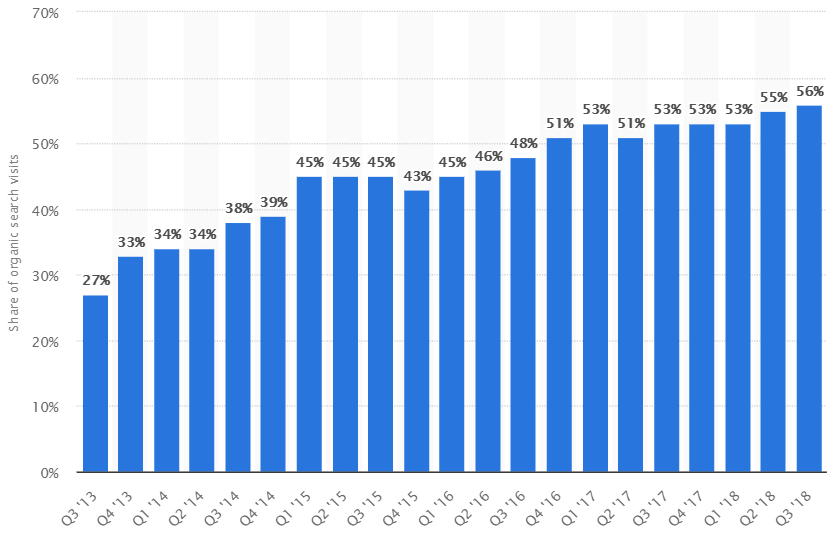
US-centric statistics from Statista show just how much the mobile share of organic searches has grown in the past few years.

During Q3 2013 27% of searches were made on mobile compared to 73% on desktop, but by Q3 2018 things were firmly weighted the other way.

Now, at least 56% of searches are being accounted for by mobile.

graph showing how much the mobile share of organic searches has grown in the last couple years

How much video viewing is mobile?

With more search activity happening on mobile, can we expect the same of video activity? The short answer is: yes.

According to eMarketer, more than 80% of video viewing is expected to be on mobile in 2019.

This is up 10% in just three years and it looks like it will keep growing.

mobile video viewers and penetration worldwide, from 2016 to 2021

YouTube videos on Google – differences between desktop and mobile

So with more people searching for, and viewing, video on their handheld devices, do we need to think a little differently about how we optimize this content?

It seems logical that Google might present video differently on mobile compared to desktop. But initial differences appear to be very small – at least for the search phrase I use as an example here, ‘top youtube videos of 2018.’

search for "top youtube videos of 2018" on desktop

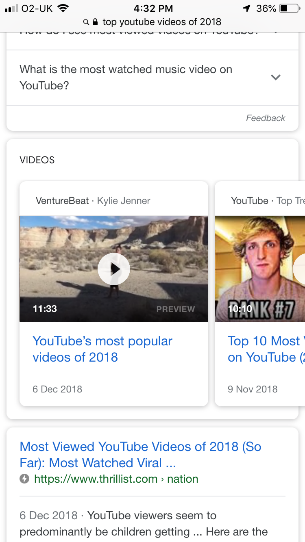
search for "top youtube videos of 2018" on mobile

On both desktop and mobile, the video results for this keyphrase appear presented in a carousel in around position 3 of the SERPs. Position 1 is given over to an infobox taken from an AdWeek ‘top 10’ style article and position 2 is a ‘People also ask’ box.

The first three videos that are viewable in this carousel are the same across devices – the leftmost being an embedded video in a VentureBeat article and the others being from YouTube. So Google might not be ranking things particularly differently depending on whether we search from desktop or mobile. But one instantly noticeable difference is the need to click (to scroll through the carousel) once on mobile in order to view the rightmost result and even half of the central result. In this case, the VentureBeat video certainly wins on instant visibility.

Another recent feature Google is including for video in its mobile SERPs is the preview

If a user scrolls to the video carousel and stops momentarily, the video begins to play silently showing selected moments. If we compare this to desktop – where the videos are static until played – mobile video SERPs are perhaps less likely to be clicked upon depending on the thumbnail it has.

The lesson for content creators here is to ensure the visual quality of your video is good throughout – you can’t simply depend on your colorful custom thumbnail to get these kinds of clicks.

While the video carousels in the Google SERPs are very similar on desktop and mobile, there are other ways video is presented which are notable.

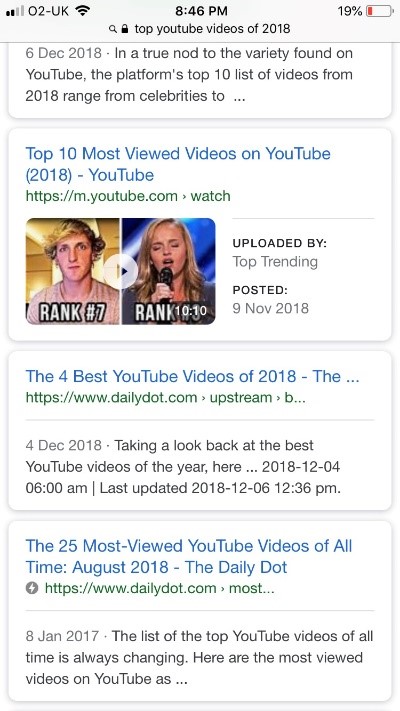
mobile search results showing a video carousel in line with text results

This mobile video listing appears in-line with the text results much the same as a conventional desktop listing.

Note that it doesn’t include the video’s description, rather opting to show who has uploaded the content and when it was posted. Subsequently, the title and thumbnail are massively important for indicating to the user that this content is relevant to them. But the name of the channel and the freshness of content will also help that decision be made.

In this case, ‘Top Trending’ as a brandname is itself very relevant for our query – and we can also see how fresh the content is.

YouTube videos on YouTube – differences between desktop and mobile

So how do things fair when searches are made on YouTube?

youtube search for "top youtube videos of 2018" on desktop

youtube search for "top youtube videos of 2018" on mobile

Again, differences are subtle. Buy they are there. Ranking-wise we still see the videos we are familiar with from the earlier Google search and they are much the same across devices.

As we might expect, though, the mobile display of YouTube.com eschews video descriptions choosing to show the thumbnail aside the title, channel name, number of views and the age of the content.

Titles are also truncated if they exceed a certain length.

In this example, our second result loses nearly half of its character count of 57 down to 34.

App vs. mobile web differences

With the growth of mobile viewing habits, it also pays to see how things potentially differ on mobile apps too.

When it comes to the SERPs as a whole, we can see the YouTube app does a better job at displaying more results above the fold – showing five full thumbnails.

In our example we can also see the app does a better job at utilizing the space next to the image – with bigger fonts and less severe editing of longer titles. The YouTubers React… video still loses some of its overlong title, but only around 5 characters.

Takeaways

It’s important to remember this isn’t a comprehensive study. Different searches may produce different results. And allowances need to be made for the diversity of size and display of mobile devices (my examples were viewed on iPhone 7).

That said, I do think certain elements of video optimization deserve more consideration in the mobile context than they do in desktop.

Here’s my hotlist:

1. Titles

Always an important aspect of video SEO. But on mobile, we need to be wary that titles are more likely to be truncated in results across mobile web and app. Try to keep them concise and with the most important aspect of the title within the first 30 characters.

2. Previews

Thumbnails are still massively important, but the use of previews on mobile is an extra thing for video content producers to consider. Is your lighting good and consistent throughout? Simply, does your whole video looks good? Because, on mobile, users may or may not make a click depending on this preview.

3. Channel brand

While mobile SERPs often tend to lose video descriptions, the channel name on which the video is published is always included – and often fairly prominently. Even if you channel name is not massively well known, is it clearly relevant for the words/phrases you want your video(s) to rank for?

4. Freshness

Similar point to the above. The date or age of the content is always visible across Google, YouTube, desktop, mobile web and app. Ensure you are updating fresh content to your channel. Mobile users can clearly see if things are out of date.

The post Mobile search and video in 2019: How visible are you? appeared first on Search Engine Watch.


from SEO – Search Engine Watch http://bit.ly/2GG5U6m
via IFTTT

Tuesday, 12 February 2019

People Ask Their Most Pressing SEO Questions — Our Experts Answer

Posted by TheMozTeam

We teamed up with our friends at Duda, a website design scaling platform service, who asked their agency customers to divulge their most pressing SEO questions, quandaries, and concerns. Our in-house SEO experts, always down for a challenge, hunkered down to collaborate on providing them with answers. From Schema.org to voice search to local targeting, we're tackling real-world questions about organic search. Read on for digestible insights and further resources!


How do you optimize for international markets?

International sites can be multi-regional, multilingual, or both. The website setup will differ depending on that classification.

  • Multi-regional sites are those that target audiences from multiple countries. For example: a site that targets users in the U.S. and the U.K.
  • Multilingual sites are those that target speakers of multiple languages. For example, a site that targets both English and Spanish-speakers.

To geo-target sections of your site to different countries, you can use a country-specific domain (ccTLD) such as “.de” for Germany or subdomains/subdirectories on generic TLDs such as “example.com/de.”

For different language versions of your content, Google recommends using different URLs rather than using cookies to change the language of the content on the page. If you do this, make use of the hreflang tag to tell Google about alternate language versions of the page.

For more information on internationalization, visit Google’s “Managing multi-regional and multilingual sites” or Moz’s guide to international SEO.


How do we communicate to clients that SEO projects need ongoing maintenance work?

If your client is having difficulty understanding SEO as a continuous effort, rather than a one-and-done task, it can be helpful to highlight the changing nature of the web.

Say you created enough quality content and earned enough links to that content to earn yourself a spot at the top of page one. Because organic placement is earned and not paid for, you don’t have to keep paying to maintain that placement on page one. However, what happens when a competitor comes along with better content that has more links than your content? Because Google wants to surface the highest quality content, your page’s rankings will likely suffer in favor of this better page.

Maybe it’s not a competitor that depreciates your site’s rankings. Maybe new technology comes along and now your page is outdated or even broken in some areas.

Or how about pages that are ranking highly in search results, only to get crowded out by a featured snippet, a Knowledge Panel, Google Ads, or whatever the latest SERP feature is?

Set-it-and-forget-it is not an option. Your competitors are always on your heels, technology is always changing, and Google is constantly changing the search experience.

SEO specialists are here to ensure you stay at the forefront of all these changes because the cost of inaction is often the loss of previously earned organic visibility.


How do I see what subpages Google delivers on a search? (Such as when the main page shows an assortment of subpages below the result, via an indent.)

Sometimes, as part of a URL’s result snippet, Google will list additional subpages from that domain beneath the main title-url-description. These are called organic sitelinks. Site owners have no control over when and which URLs Google chooses to show here aside from deleting or NoIndexing the page from the site.

If you’re tracking keywords in a Moz Pro Campaign, you have the ability to see which SERP features (including sitelinks) your pages appear in.

The Moz Keyword Explorer research tool also allows you to view SERP features by keyword:


What are the best techniques for analyzing competitors?

One of the best ways to begin a competitor analysis is by identifying the URLs on your competitor’s site that you’re directly competing with. The idea of analyzing an entire website against your own can be overwhelming, so start with the areas of direct competition.

For example, if you’re targeting the keyword “best apple pie recipes,” identify the top ranking URL(s) for that particular query and evaluate them against your apple pie recipe page.

You should consider comparing qualities such as:

Moz also created the metrics Domain Authority (DA) and Page Authority (PA) to help website owners better understand their ranking ability compared to their competitors. For example, if your URL has a PA of 35 and your competitor’s URL has a PA of 40, it’s likely that their URL will rank more favorably in search results.

Competitor analysis is a great benchmarking tool and can give you great ideas for your own strategies, but remember, if your only strategy is emulation, the best you’ll ever be is the second-best version of your competitors!


As an SEO agency, can you put a backlink to your website on clients’ pages without getting a Google penalty? (Think the Google Penguin update.)

Many website design and digital marketing agencies add a link to their website in the footer of all their clients’ websites (usually via their logo or brand name). Google says in their quality guidelines that “creating links that weren’t editorially placed or vouched for by the site’s owner on a page, otherwise known as unnatural links, can be considered a violation of our guidelines” and they use the example of “widely distributed links in the footers or templates of various sites.” This does not mean that all such footer links are a violation of Google’s guidelines. What it does mean is that these links have to be vouched for by the site’s owner. For example, an agency cannot require this type of link on their clients’ websites as part of their terms of service or contract. You must allow your client the choice of using nofollow or removing the link.

The fourth update of the Google Penguin algorithm was rolled into Google’s core algorithm in September of 2016. This new “gentler” algorithm, described in the Google Algorithm Change History, devalues unnatural links, rather than penalizing sites, but link schemes that violate Google’s quality guidelines should still be avoided.


We’re working on a new website. How do we communicate the value of SEO to our customers?

When someone searches a word or phrase related to a business, good SEO ensures that the business’s website shows up prominently in the organic (non-ad) search results, that their result is informative and enticing enough to prompt searchers to click, and that the visitor has a positive experience with the website. In other words, good SEO helps a website get found, get chosen, and convert new business.

That’s done through activities that fall into three main categories:

  • Content: Website content should be written to address your audience’s needs at all stages of their purchase journey: from top-of-funnel, informational content to bottom-of-funnel, I-want-to-buy content. Search engine optimized content is really just content that is written around the topics your audience wants and in the formats they want it, with the purpose of converting or assisting conversions.
  • Links: Earning links to your web content from high-quality, relevant websites not only helps Google find your content, it signals that your site is trustworthy.
  • Accessibility: Ensuring that your website and its content can be found and understood by both search engines and people. A strong technical foundation also increases the likelihood that visitors to the website have a positive experience on any device.

Why is SEO valuable? Simply put, it’s one more place to get in front of people who need the products or services you offer. With 40–60 billion Google searches in the US every month, and more than 41% / 62% (mobile / desktop) of clicks going to organic, it’s an investment you can’t afford to ignore.


How do you optimize for voice search? Where do you find phrases used via tools like Google Analytics?

Google doesn’t yet separate out voice query data from text query data, but many queries don’t change drastically with the medium (speaking vs. typing the question), so the current keyword data we have can still be a valuable way to target voice searchers. It’s important here to draw the distinction between voice search (“Hey Google, where is the Space Needle?”) and voice commands (ex: “Hey Google, tell me about my day”) — the latter are not queries, but rather spoken tasks that certain voice assistant devices will respond to. These voice commands differ from what we’d type, but they are not the same as a search query.

Voice assistant devices typically pull their answers to informational queries from their Knowledge Graph or from the top of organic search results, which is often a featured snippet. That’s why one of the best ways to go after voice queries is to capture featured snippets.

If you’re a local business, it’s also important to have your GMB data completely and accurately filled out, as this can influence the results Google surfaces for voice assistance like, “Hey Google, find me a pizza place near me that’s open now.”


Should my clients use a service such as Yext? Do they work? Is it worth it?

Automated listings management can be hugely helpful, but there are some genuine pain points with Yext, in particular. These include pricing (very expensive) and the fact that Yext charges customers to push their data to many directories that see little, if any, human use. Most importantly, local business owners need to understand that Yext is basically putting a paid layer of good data over the top of bad data — sweeping dirt under the carpet, you might say. Once you stop paying Yext, they pull up the carpet and there’s all your dirt again. By contrast, services like Moz Local (automated citation management) and Whitespark (manual citation management) correct your bad data at the source, rather than just putting a temporary paid Band-Aid over it. So, investigate all options and choose wisely.


How do I best target specific towns and cities my clients want to be found in outside of their physical location?

If you market a service area business (like a plumber), create a great website landing page with consumer-centric, helpful, unique content for each of your major service cities. Also very interesting for service area businesses is the fact that Google just changed its handling of setting the service radius in your Google My Business dashboard so that it reflects your true service area instead of your physical address. If you market a brick-and-mortar business that customers come to from other areas, it’s typically not useful to create content saying, “People drive to us from X!” Rather, build relationships with neighboring communities in the real world, reflect them on your social outreach, and, if they’re really of interest, reflect them on your website. Both service area businesses and bricks-and-mortar models may need to invest in PPC to increase visibility in all desired locations.


How often should I change page titles and meta descriptions to help local SEO?

While it’s good to experiment, don’t change your major tags just for the sake of busy work. Rather, if some societal trend changes the way people talk about something you offer, consider editing your titles and descriptions. For example, an auto dealership could realize that its consumers have started searching for “EVs” more than electric vehicles because society has become comfortable enough with these products to refer to them in shorthand. If keyword research and trend analysis indicate a shift like this, then it may be time to re-optimize elements of your website. Changing any part of your optimization is only going to help you rank better if it reflects how customers are searching.

Read more about title tags and metas:


Should you service clients within the same niche, since there can only be one #1?

If your keywords have no local intent, then taking on two clients competing for the same terms nationally could certainly be unethical. But this is a great question, because it presents the opportunity to absorb the fact that for any keyword for which Google perceives a local intent, there is no longer only one #1. For these search terms, both local and many organic results are personalized to the location of the searcher.

Your Mexican restaurant client in downtown isn’t really competing with your Mexican restaurant client uptown when a user searches for “best tacos.” Searchers’ results will change depending on where they are in the city when they search. So unless you’ve got two identical businesses within the same couple of blocks in a city, you can serve them both, working hard to find the USP of each client to help them shine bright in their particular setting for searchers in close proximity.


Is it better to have a one-page format or break it into 3–5 pages for a local service company that does not have lengthy content?

This question is looking for an easy way out of publishing when you’ve become a publisher. Every business with a website is a publisher, and there’s no good excuse for not having adequate content to create a landing page for each of your services, and a landing page for each of the cities you serve. I believe this question (and it’s a common one!) arises from businesses not being sure what to write about to differentiate their services in one location from their services in another. The services are the same, but what’s different is the location!

Publish text and video reviews from customers there, showcase your best projects there, offer tips specific to the geography and regulations there, interview service people, interview experts, sponsor teams and events in those service locations, etc. These things require an investment of time, but you’re in the publishing business now, so invest the time and get publishing! All a one-page website shows is a lack of commitment to customer service. For more on this, read Overcoming Your Fear of Local Landing Pages.


How much content do you need for SEO?

Intent, intent, intent! Google’s ranking signals are going to vary depending on the intent behind the query, and thank goodness for that! This is why you don’t need a 3,000-word article for your product page to rank, for example.

The answer to “how much content does my page need?” is “enough content for it to be complete and comprehensive,” which is a subjective factor that is going to differ from query to query.

Whether you write 300 words or 3,000 words isn’t the issue. It’s whether you completely and thoroughly addressed the page topic.

Check out these Whiteboard Fridays around content for SEO:


Sign up for The Moz Top 10, a semimonthly mailer updating you on the top ten hottest pieces of SEO news, tips, and rad links uncovered by the Moz team. Think of it as your exclusive digest of stuff you don't have time to hunt down but want to read!


from The Moz Blog http://bit.ly/2TGLFJv
via IFTTT

The Basics of Building an Intent-based Keyword List

Posted by TheMozTeam

This week, we're taking a deep into search intent.

The STAT whitepaper looked at how SERP features respond to intent, and the bonus blog posts broke things down even further and examined how individual intent modifiers impact SERP features, the kind of content that Google serves at each stage of intent, and how you can set up your very own search intent projects.

Search intent is the new demographics, so it only made sense to get up close and personal with it. Of course, in order to bag all those juicy search intent tidbits, we needed a great intent-based keyword list. Here’s how you can get your hands on one of those.

Gather your core keywords

First, before you can even think about intent, you need to have a solid foundation of core keywords in place. These are the products, features, and/or services that you’ll build your search intent funnel around.

But goodness knows that keyword list-building is more of an art than a science, and even the greatest writers (hi, Homer) needed to invoke the muses (hey, Calliope) for inspiration, so if staring at your website isn’t getting the creative juices flowing, you can look to a few different places for help.

Snag some good suggestions from keyword research tools

Lots of folks like to use the Google Keyword Planner to help them get started. Ubersuggest and Yoast’s Google Suggest Expander will also help add keywords to your arsenal. And Answer The Public gives you all of that, and beautifully visualized to boot.

Simply plunk in a keyword and watch the suggestions pour in. Just remember to be critical of these auto-generated lists, as odd choices sometimes slip into the mix. For example, apparently we should add [free phones] to our list of [rank tracking] keywords. Huh.

Spot inspiration on the SERPs

Two straight-from-the-SERP resources that we love for keyword research are the “People also ask” box and related searches. These queries are Google-vetted and plentiful, and also give you some insight into how the search engine giant links topics.

If you’re a STAT client, you can generate reports that will give you every question in a PAA box (before it gets infinite), as well as each of the eight related searches at the bottom of a SERP. Run the reports for a couple of days and you’ll get a quick sense of which questions and queries Google favours for your existing keyword set.

A quick note about language & location

When you’re in the UK, you push a pram, not a stroller; you don’t wear a sweater, you wear a jumper. This is all to say that if you’re in the business of global tracking, it’s important to keep different countries’ word choices in mind. Even if you’re not creating content with them, it’s good to see if you’re appearing for the terms your global searchers are using.

Add your intent modifiers

Now it’s time to tackle the intent bit of your keyword list. And this bit is going to require drawing some lines in the sand because the modifiers that occupy each intent category can be highly subjective — does “best” apply transactional intent instead of commercial?

We’ve put together a loose guideline below, but the bottom line is that intent should be structured and classified in a way that makes sense to your business. And if you’re stuck for modifiers to marry to your core keywords, here’s a list of 50+ to help with the coupling.

Informational intent

The searcher has identified a need and is looking for the best solution. These keywords are the core keywords from your earlier hard work, plus every question you think your searchers might have if they’re unfamiliar with your product or services.

Your informational queries might look something like:

  • [product name]
  • what is [product name]
  • how does [product name] work
  • how do I use [product name]
Commercial intent

At this stage, the searcher has zeroed in on a solution and is looking into all the different options available to them. They’re doing comparative research and are interested in specific requirements and features.

For our research, we used best, compare, deals, new, online, refurbished, reviews, shop, top, and used.

Your commercial queries might look something like:

  • best [product name]
  • [product name] reviews
  • compare [product name]
  • what is the top [product name]
  • [colour/style/size] [product name]
Transactional intent (including local and navigational intent)

Transactional queries are the most likely to convert and generally include terms that revolve around price, brand, and location, which is why navigational and local intent are nestled within this stage of the intent funnel.

For our research, we used affordable, buy, cheap, cost, coupon, free shipping, and price.

Your transactional queries might look something like:

  • how much does [product name] cost
  • [product name] in [location]
  • order [product name] online
  • [product name] near me
  • affordable [brand name] [product name]
A tip if you want to speed things up

A super quick way to add modifiers to your keywords and save your typing fingers is by using a keyword mixer like this one. Just don’t forget that using computer programs for human-speak means you’ll have to give them the ol’ once-over to make sure they still make sense.

Audit your list

Now that you’ve reached for the stars and got yourself a huge list of keywords, it’s time to bring things back down to reality and see which ones you’ll actually want to keep around.

No two audits are going to look the same, but here are a few considerations you’ll want to keep in mind when whittling your keywords down to the best of the bunch.

  1. Relevance. Are your keywords represented on your site? Do they point to optimized pages
  2. Search volume. Are you after highly searched terms or looking to build an audience? You can get the SV goods from the Google Keyword Planner.
  3. Opportunity. How many clicks and impressions are your keywords raking in? While not comprehensive (thanks, Not Provided), you can gather some of this info by digging into Google Search Console.
  4. Competition. What other websites are ranking for your keywords? Are you up against SERP monsters like Amazon? What about paid advertising like shopping boxes? How much SERP space are they taking up? Your friendly SERP analytics platform withshare of voice capabilities (hi!) can help you understand your search landscape.
  5. Difficulty. How easy is your keyword going to be to win? Search volume can give you a rough idea — the higher the search volume, the stiffer the competition is likely to be — but for a different approach, Moz’s Keyword Explorer has a Difficulty score that takes Page Authority, Domain Authority, and projected click-through-rate into account.

By now, you should have a pretty solid plan of attack to create an intent-based keyword list of your very own to love, nurture, and cherish.

If, before you jump headlong into it, you’re curious what a good chunk of this is going to looks like in practice, give this excellent article by Russ Jones a read, or drop us a line. We’re always keen to show folks why tracking keywords at scale is the best way to uncover intent-based insights.

Read on, readers!

More in our search intent series:

This post was originally published on the STAT blog.


Sign up for The Moz Top 10, a semimonthly mailer updating you on the top ten hottest pieces of SEO news, tips, and rad links uncovered by the Moz team. Think of it as your exclusive digest of stuff you don't have time to hunt down but want to read!


from The Moz Blog http://bit.ly/2WVLxYA
via IFTTT

Social Media Today